


Good Tuesday morning from your Hometown Lender. Let’s get to today’s market analysis!
Yesterday started out ok, but mortgage bonds started selling off around lunchtime and ended the day worse. The selling in bonds lined up with yesterday’s rise in oil prices, and yesterday afternoon was a firm shift in the outlook for rates. Rate sheets today will be worse than yesterday.
Oil prices are at a three-week high with no hope in sight that a deal to open the Strait of Hormuz will happen. Global bond yields have hit multi-decade highs on fears of inflation around the world. The 30yr Treasury yield rose to the highest it’s been since 2007, and the 10yr yield is the highest in about a year. The last few weeks, it looked like there was a ceiling for rates, and that we didn’t have much to worry about. The outlook has shifted; it looks like it will get worse before it gets better. Now to find out just how much worse…
Market Analysis – From a higher and better view:
Market Analysis –Quick Snapshot
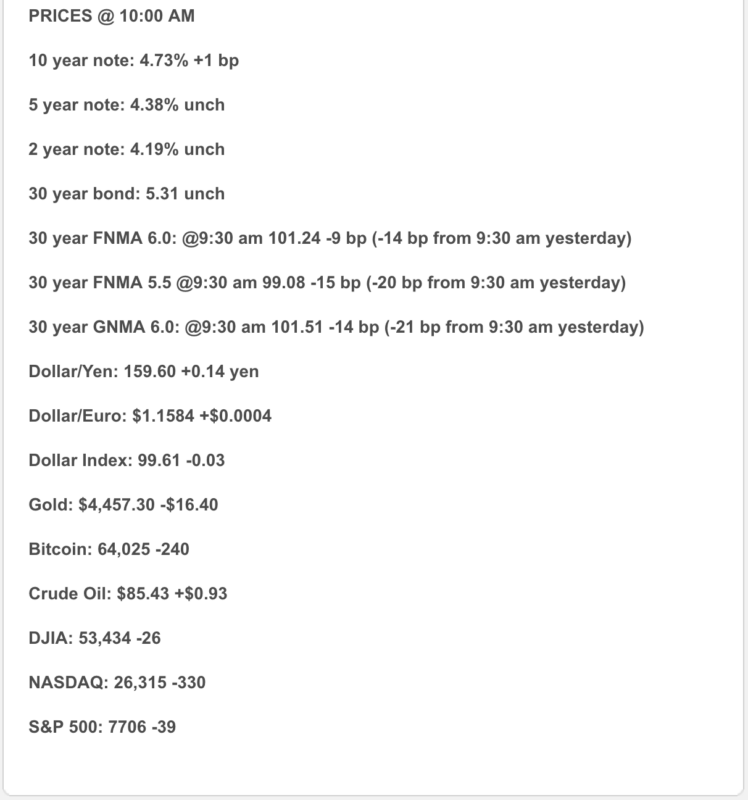
- 10-year Treasury: Approximately 4.74%, with yields moving higher for a third session.
- Mortgage rates: National 30-year averages remain around 6.7%–6.8%, depending on methodology and borrower profile.
- Oil: Above $90 per barrel, adding renewed inflation pressure.
- Federal Reserve: Current range is 3.50%–3.75%; 90% of economists expect no change in September.
- Market mood: Bonds are under pressure as geopolitical risk, inflation concerns and federal borrowing collide. That is not exactly the mortgage-rate trifecta we ordered. (Reuters, Mortgage News Daily)
What It Means
Today’s market analysis offered something for everyone—and comfort for almost no one.
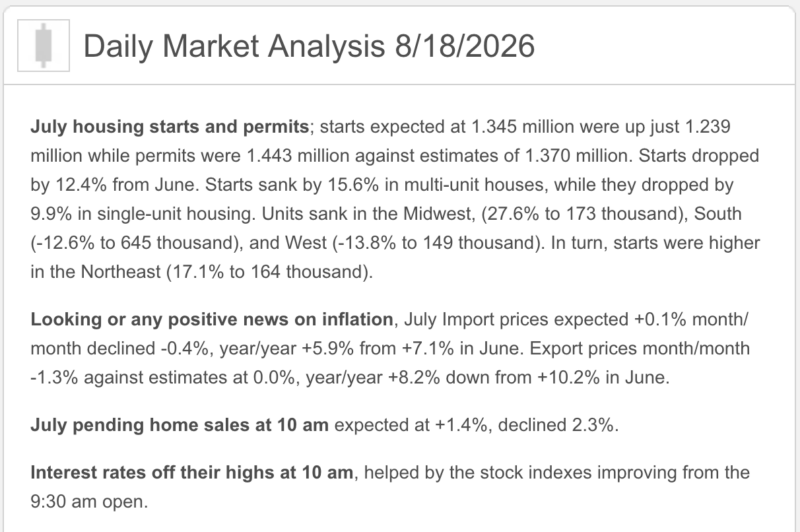
Import prices declined 0.4% in July, helped by lower fuel costs. However, they remain 5.9% higher year over year, while nonfuel import prices rose 4.5% annually. Translation: monthly inflation improved, but underlying cost pressure remains stubborn. (BLS)
Meanwhile, the U.S.–Iran conflict, restricted oil flows through the Strait of Hormuz, rising federal debt and heavy bond issuance are pushing longer-term Treasury yields higher. The Fed is caught between softer employment and housing data on one side—and oil-driven inflation on the other.
The most likely September move remains no move at all. (Reuters Fed outlook)
Market Analysis –Housing & Mortgage Strategy
July housing data weakened:
- Single-family construction fell 9.9%.
- Total housing starts dropped 12.4%.
- Pending existing-home sales declined 2.3%.
- Single-family permits increased 2.5%, offering a modest future bright spot. (Reuters)
Fewer starts may eventually limit supply, while slower sales create more negotiating leverage today. This remains a structure-the-payment market: seller credits, temporary buydowns, permanent buydowns and thoughtful product selection can matter more than waiting for the perfect headline rate.
Lock vs. Float
- Closing within 15 days: Lean toward locking.
- Closing in 15–30 days: Case by case, with a modest locking bias.
- Closing beyond 30 days: A cautious float may work—but only with a defined target and exit strategy.
This is not a panic market. It is a planning market. Floating without a plan is just cardio with disclosures.
Stay safe and make today great!