Good Thursday AM, from your Hometown Lender,
Let’s start with $304 billion.
That was the increase yesterday in the combined net worth of the world’s wealthiest people, the largest one-day gain in the history of the Bloomberg Billionaires Index. $200b has been given back today.
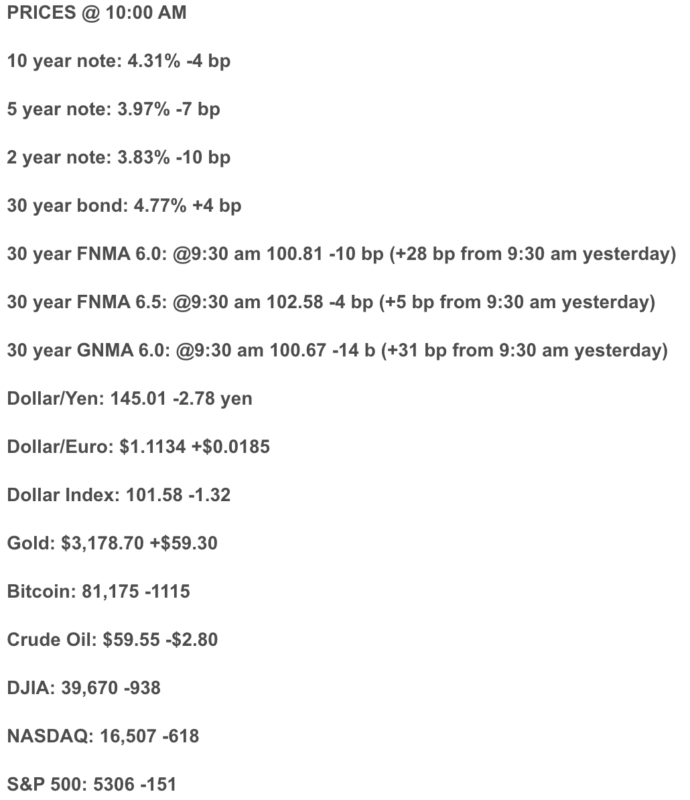
Rates are better than yesterday, but the bond market is very volatile (still).
Reprice risk on the day is moderate and will be for as long as I can see for the moment. Rates are likely near “neutral” right now, meaning we likely won’t see them move significantly lower from here for awhile and hopefully won’t see them move much higher that is until the next tariff headline.
Yesterday’s unbelievable reversal in equities and substantial improvement in bonds was clearly tied to President Trump capitulating over fears in the markets (mostly the bond market) and hitting the pause button on a large number of tariffs although not China. A few days ago, the announcement of a pause would have hurt bonds and pushed rates worse. That was a few days ago, when we were seeing a flight to safety.
Once the bond market short circuited, the rules changed, and we saw a huge improvement to both stocks and bonds.
This morning’s CPI inflation data showed cooler inflation than was expected, but bonds barely moved. Normally this would have made for a great morning rate sheet as bonds rallied, however with tariffs still in play markets believe we will see future inflation regardless of how good this report was. It is vey difficult to project where the markets are heading. Monday the 10yr hit 3.87%, Tuesday 4.20%, Wednesday 4.5%, this am 4.37%.
Here are a couple of pieces from Bloomberg and the WSJ to explain and confuse on the bond market movement.
For all of the attention paid to the slump in stocks since Donald Trump announced his tariffs, in the end it was the bond market that prompted him to reverse course.
Yields soared as trade levies took effect just after midnight yesterday, with the 10-year Treasury seeing its biggest three-day jump since 2001.
Yields soared as trade levies took effect just after midnight yesterday, with the 10-year Treasury seeing its biggest three-day jump since 2001.
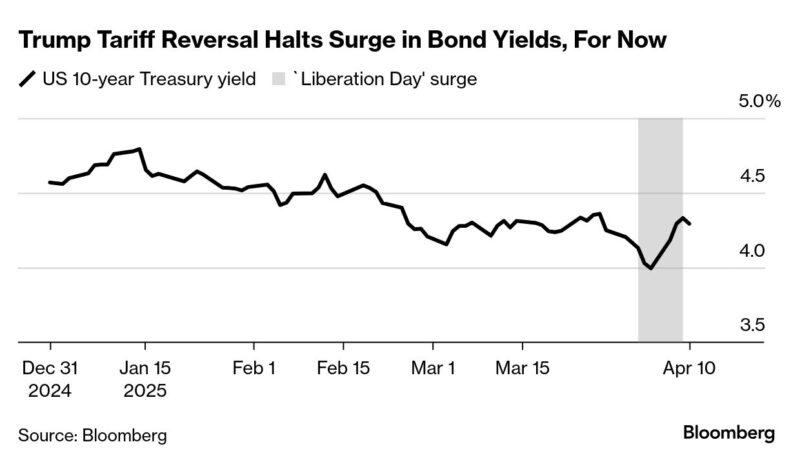
Within 14 hours, Trump would go on to execute one of the biggest economic policy reversals in modern presidential history, implementing a three-month pause on expanded tariffs on dozens of countries and rallying stocks that had been in free-fall since his announcement a week earlier.
Today, bonds are gaining again, sending yields lower.
“The ‘blink’ came sooner than we expected, probably forced by the markets,” said Mohit Kumar, strategist at Jefferies International.
Traders are now bracing for prolonged negotiations that could weigh on markets for months. They will face the increasingly complicated task of trying to figure out how shifts in global trade will impact the twin levers of growth and inflation — both important drivers of rate expectations.
For Trump, the about-face came as he confronted a worst-case scenario: Voters who had returned him to the White House because of inflation now faced both increased prices and higher borrowing costs.
During a meeting with race-car drivers on the South Lawn of the White House yesterday afternoon, Trump conceded that the decision was driven in no small part by the chaos roiling markets. Investors, he said, “were getting a little bit yippy, a little bit afraid.”
“The bond vigilantes have struck again,’’ said Ed Yardeni, founder of Yardeni Research. “As far as we can tell, at least with respect to US financial markets, they are the only 1.000 hitters in history.’’
And…
Anyone who’s had the pleasure of teaching a teenager how to drive feels reassured by the knowledge that modern cars come equipped with airbags. Imagine how much more exciting it would be if some were filled with rocks instead.
Super-safe Treasury bonds are like airbags for your portfolio and for the economy. When investors in riskier assets flee to safety and Fed interest rate cuts look more likely then their yields normally fall and prices rise. Those bond gains offset some of your stock losses and can be used to buy discounted shares, if you’re brave. Lower bond yields also reduce the cost of mortgages and corporate loans based on them, aiding a recovery.
The worst year for a standard stock-and-bonLet’sd investment portfolio in the past century, adjusted for inflation, wasn’t during The Great Depression, the tech bust or the financial crisis. It was 1974, when surging inflation made bond prices fall too.
Financial markets’ safety equipment looked dangerously faulty again this past week as bond yields rose unexpectedly during the panic. Explanations vary, from problems at hedge funds that trade bond futures, to fears about endless budget deficits, to the dollar losing its vaunted haven status over the past week’s theatrics. Whatever the reason, it makes stocks look like less of a relative bargain.
How can you measure that? Not the widely cited price-to-earnings or P/E ratio, which is the current level of the S&P 500 index divided by its companies’ expected earnings in the coming year. That sometimes makes stocks look more expensive after a big selloff. In a recession, the “E” can temporarily take a bigger hit than the “P.”
Using 10 years of historical earnings instead and adjusting them for inflation—a technique popularized by Nobel Prize-winning economist Robert Shiller—fixes that. The Shiller P/E is more informative if you set it against 10-year Treasury notes, a comparison that has had a decent track record predicting future stock returns.
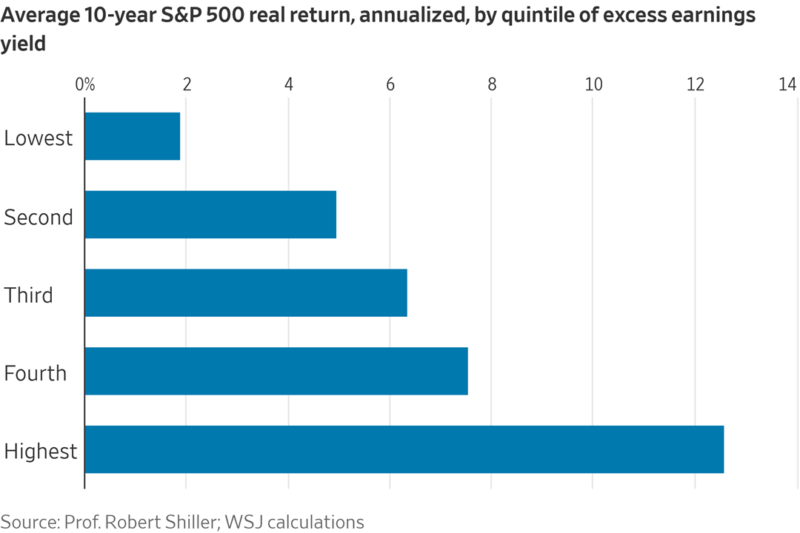
To see how attractive stocks are, turn that Shiller P/E upside down to calculate an earnings yield, just like on a bond. The E/P ratio should be higher than Treasury yields since stocks aren’t risk-free.
The upshot? Right now, stocks look pretty unappetizing. The difference was just 1.65 percentage points after Wednesday’s fireworks. The extra reward for buying stocks was a much better 5.6 points at the bottom of the Covid-19 bear market, 7.3 points at the bottom of the financial crisis and 3.1 points after the tech bust.
This measure is called the excess yield. The chart below divides every month since the start of the 20th Century into five buckets based on how high that yield was and shows how much stocks returned, adjusting for inflation, over the decade that followed. They’ve averaged 1.89% when around today’s level.
Check your mirrors and keep both hands on the wheel.
Stay safe and make today great!